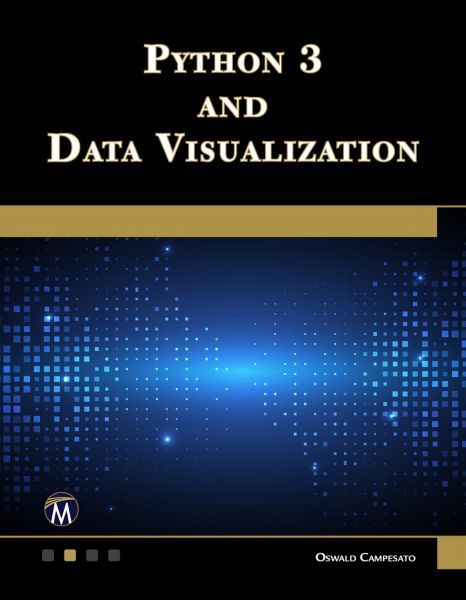
Python 3 and Data Visualization
Mastering Graphics and Data Manipulation with Python
Python 3 and Data Visualization provides an in-depth exploration of Python 3 programming and data visualization techniques. The course begins with an introduction to Python, covering essential topics from basic data types and loops to advanced constructs such as dictionaries and matrices. This foundation prepares readers for the next section, which focuses on NumPy and its powerful array operations, seamlessly leading into data visualization using prominent libraries like Matplotlib.
Chapter 6 delves into Seaborn's rich visualization tools, providing insights into datasets like Iris and Titanic. The appendix covers additional visualization tools and techniques, including SVG graphics and D3 for dynamic visualizations. The companion files include numerous Python code samples and figures, enhancing the learning experience.
From foundational Python concepts to advanced data visualization techniques, this course serves as a comprehensive resource for both beginners and seasoned professionals, equipping them with the necessary skills to effectively visualize data.
Versandkostenfreie Lieferung! (eBook-Download)
Als Sofort-Download verfügbar
- Artikel-Nr.: SW9781836645702450914
- Artikelnummer SW9781836645702450914
-
Autor
Oswald Campesato, Mercury Learning and Information
- Verlag Packt Publishing
- Seitenzahl 421
- Veröffentlichung 09.08.2024
- Barrierefreiheit
- Keine Angabe: Keine Informationen zur Barrierefreiheit bereitgestellt
- ISBN 9781836645702
- Verlag Packt Publishing

